Smart Digital Therapeutics for Alcohol Use Disorder: Algorithms for Prediction and Adaptive Intervention
Lapse Prediction in Patients with AUD
- 151 patients with AUD
- Early in recovery (1-8 weeks)
- Committed to abstinence throughout study
- Followed for up to 3 months
- Collected active and passive personal sensing data streams

![]()
GOAL: Develop a temporally precise lapse monitoring (prediction) system for patients with AUD
4x Daily Ecological Momentary Assessments

- Current
- Craving
- Affect
- Risky situations
- Stressful events
- Pleasant events
- Future
- Risky situations
- Stressful events
- Confidence
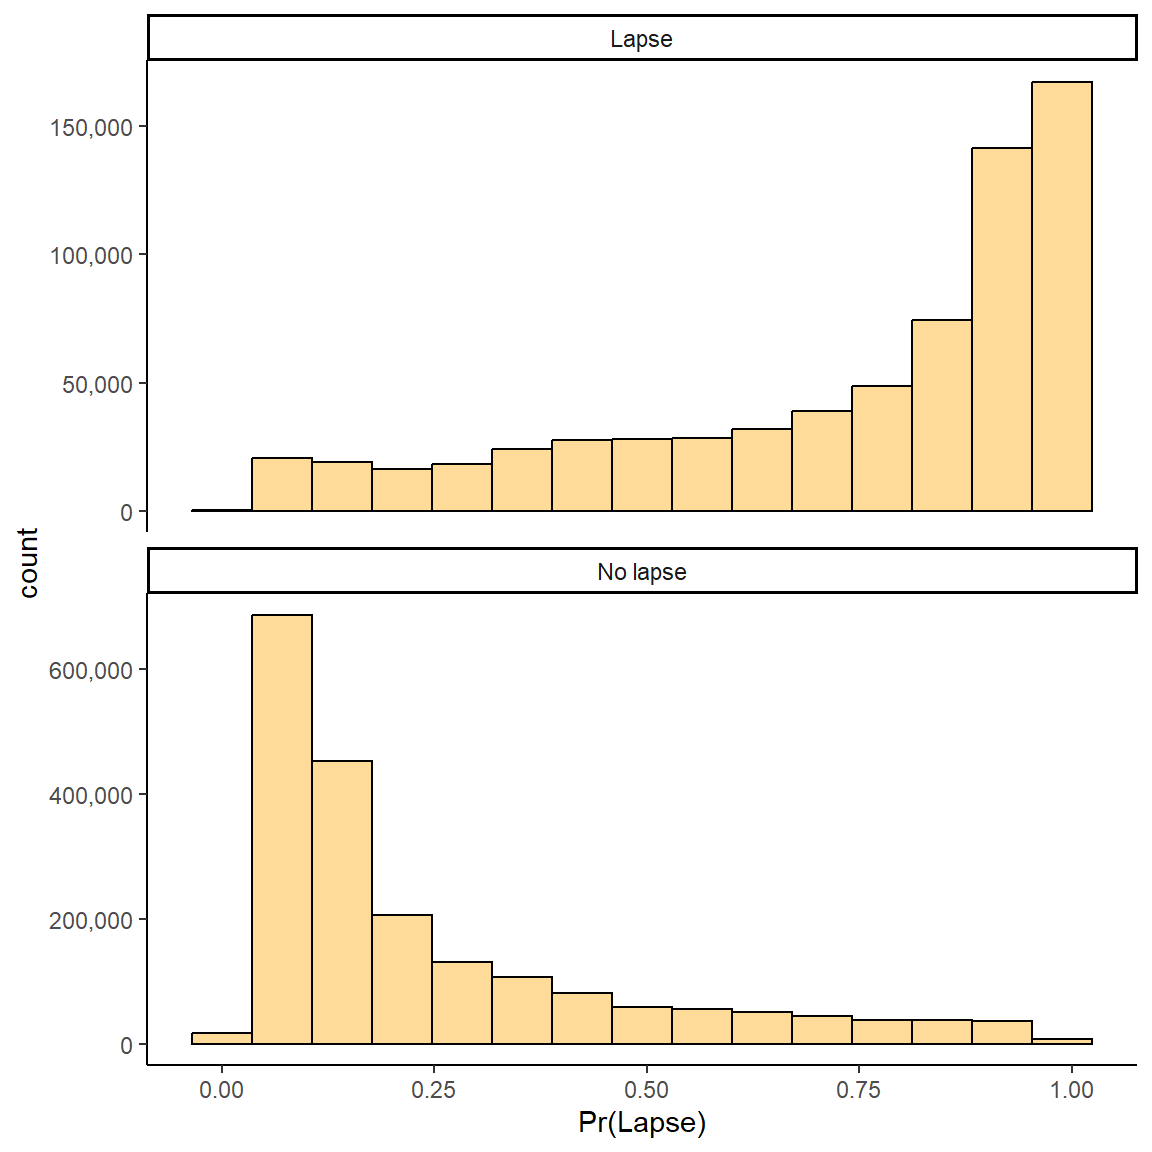
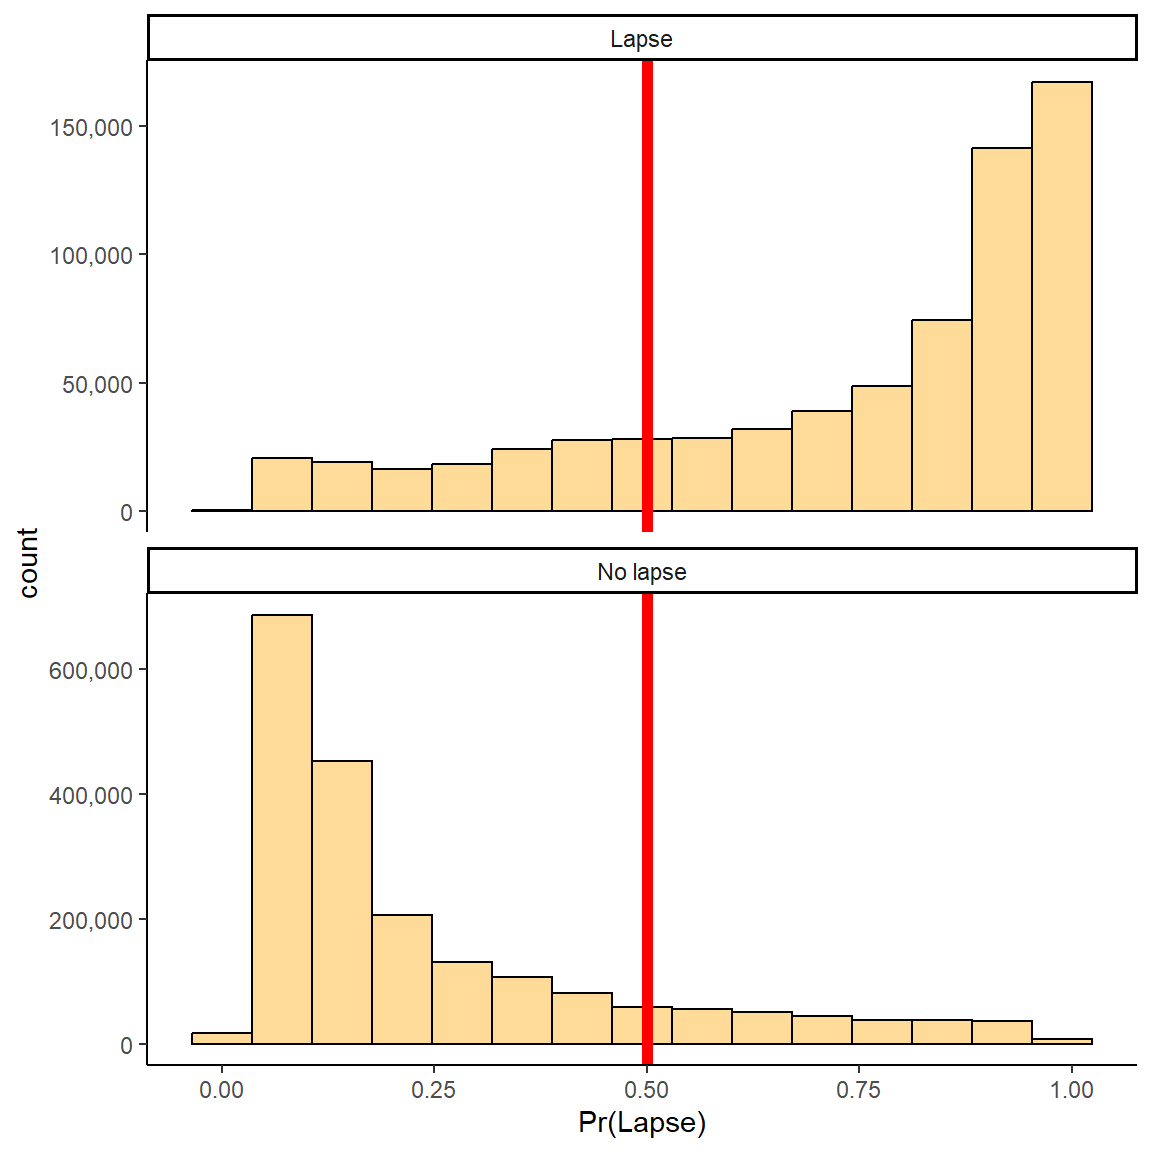
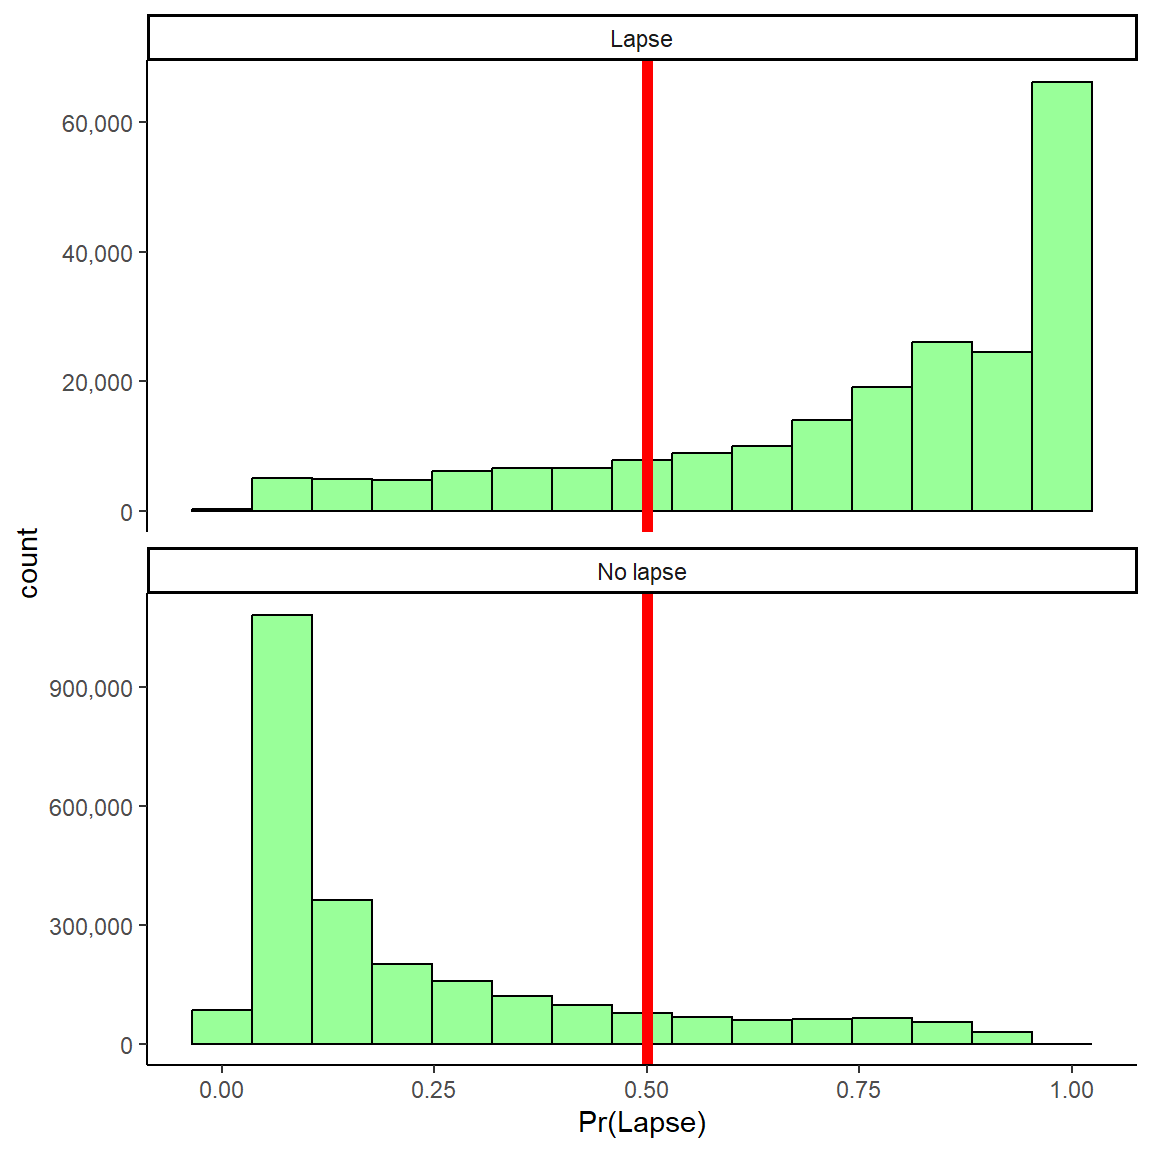
1 Week: Probabilities for No Lapse and Lapse
Model predicts probability of lapse in next week for “new” observations in test set
Can panel predictions for GROUND TRUTH lapse and no lapse observations
Want high probabilities to be high for true lapses and low for true no lapses
Need decision threshold for classification (.50 default)
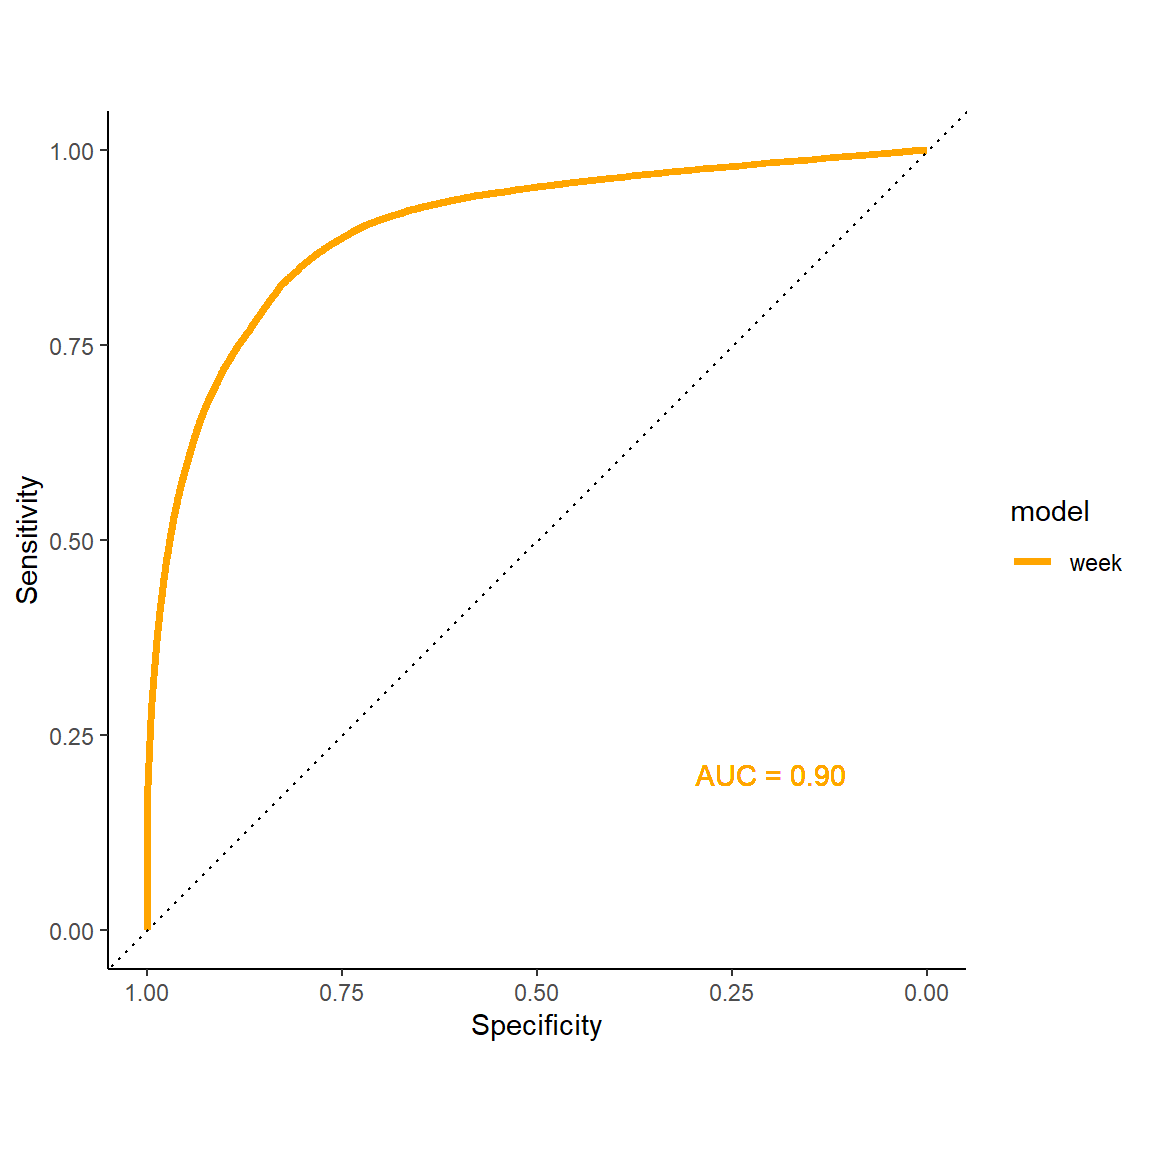
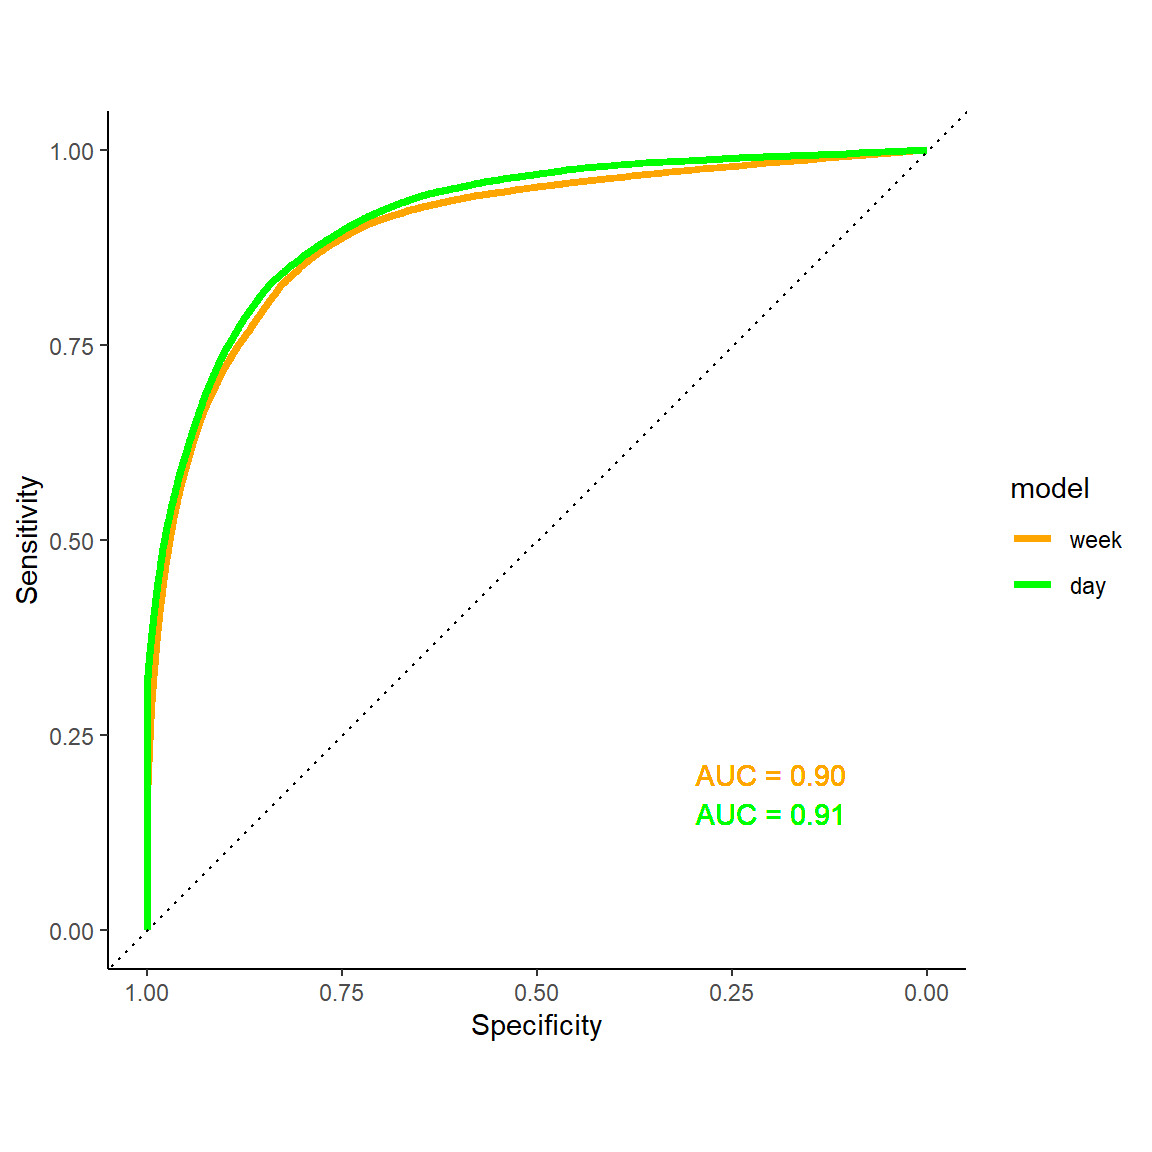
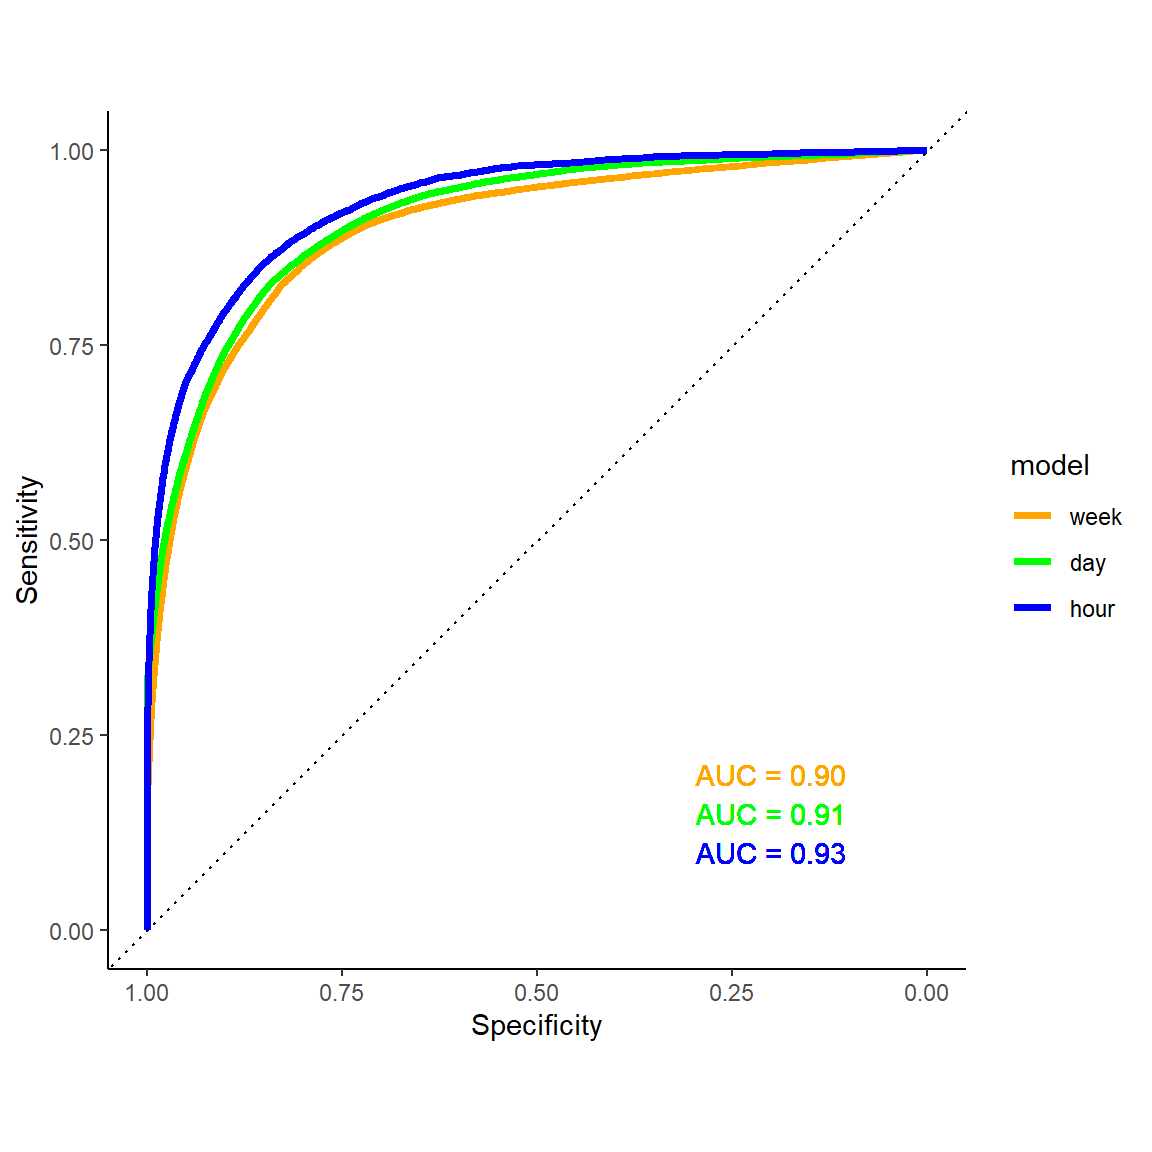
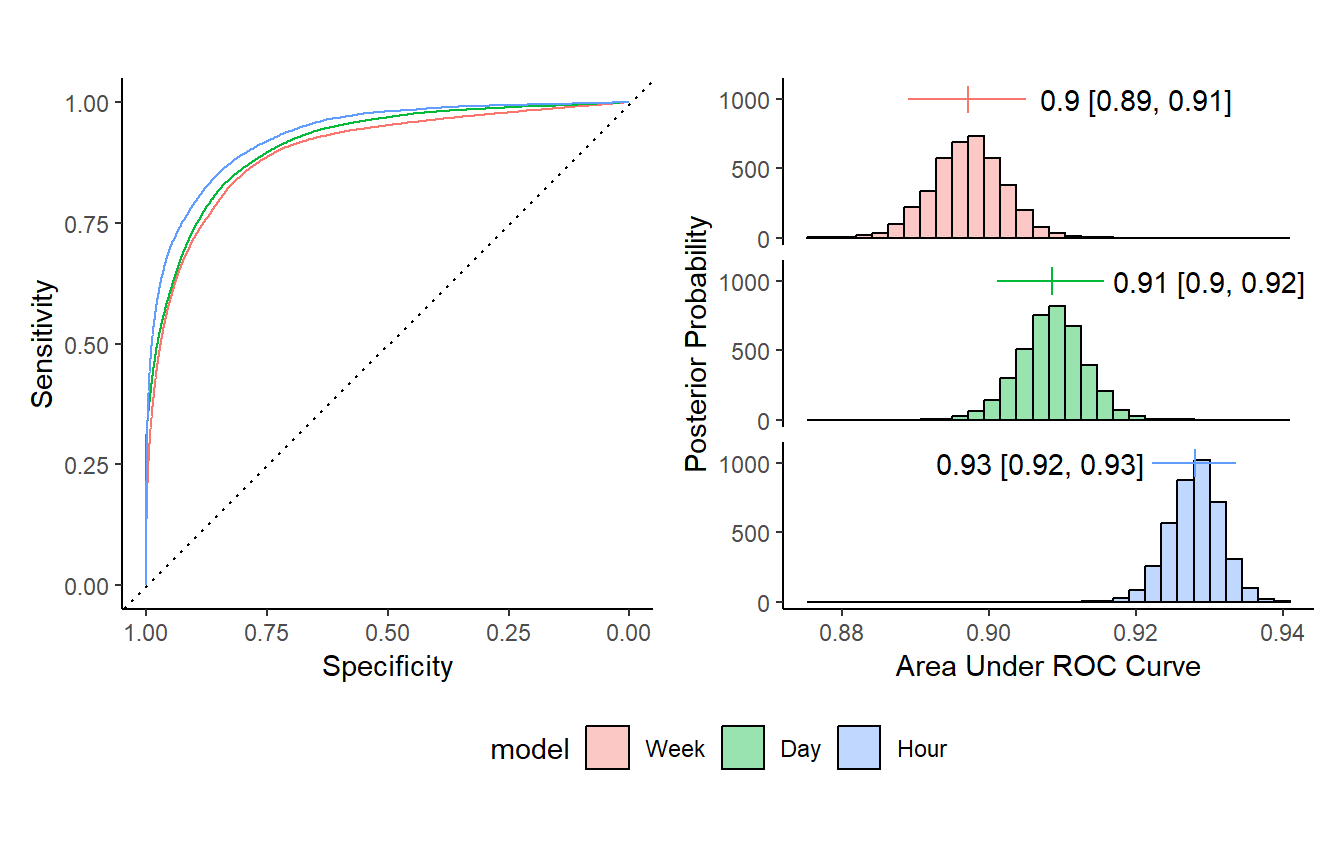
1 Week: ROC Curve
Area under the ROC curve (AUC)
Across all decision thresholds
~.5 (random) – 1.0 (perfect)
1 Day: ROC Curve
1 Hour: ROC Curve
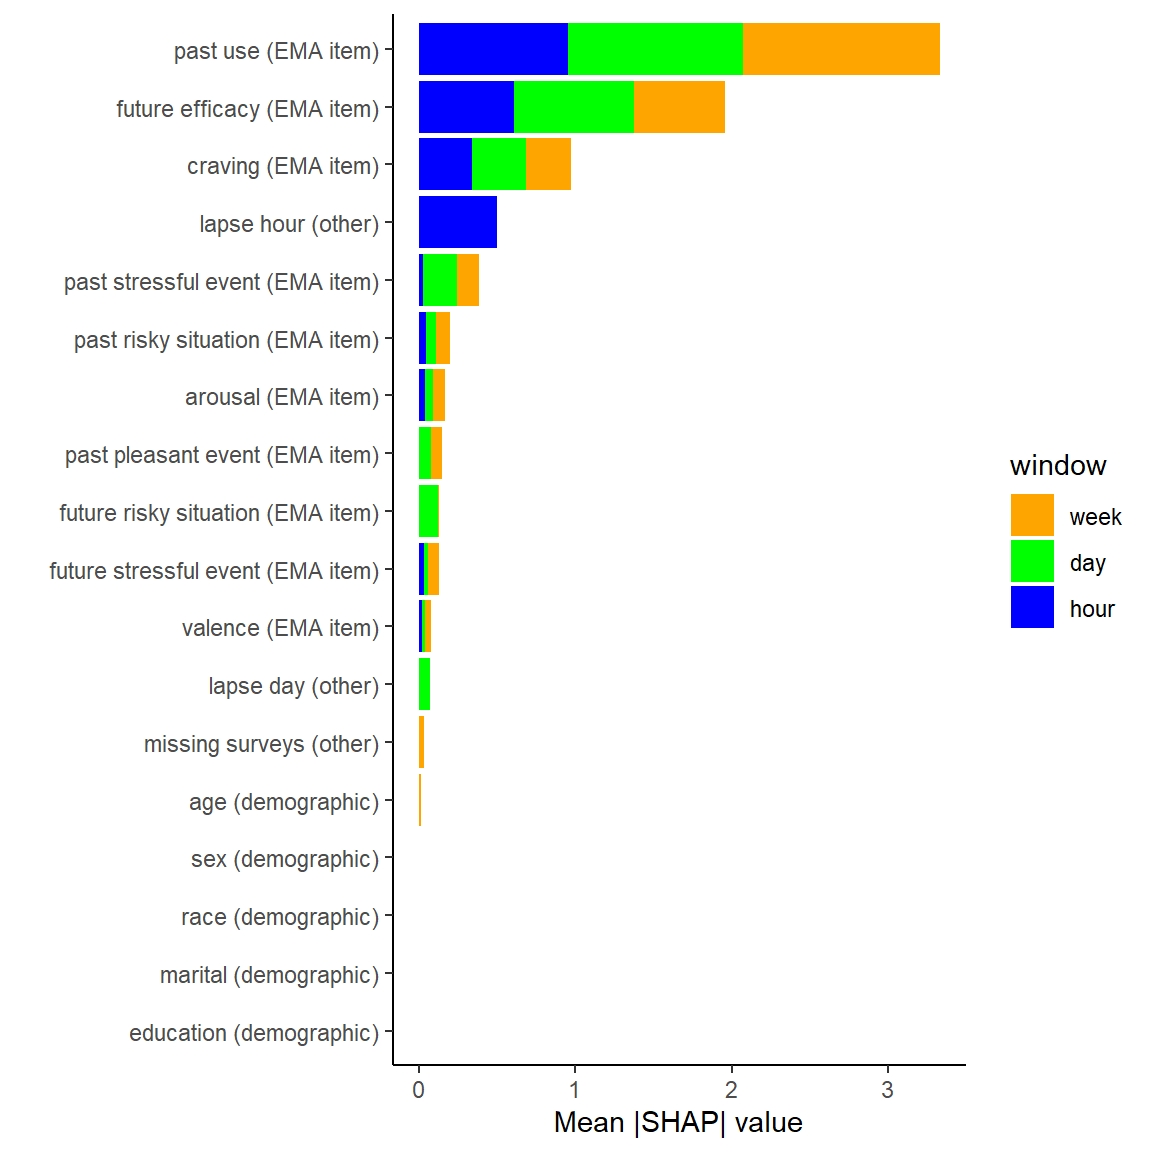
Global Variable Importance by Model
- All EMA items impact lapse probability (both globally and locally)
- Demographics not particularly important (but limited race/ethnicity diversity)
- Lapse day and Lapse hour are useful for day and hour level models as expected
Impact of Decision Thresholds: 1 day
| Thres = 0.50 | Thres = 0.90 | |
|---|---|---|
| Sensitivity | 0.81 | |
| Specificity | 0.86 | |
| PPV | 0.32 |
Impact of Decision Thresholds: 1 day
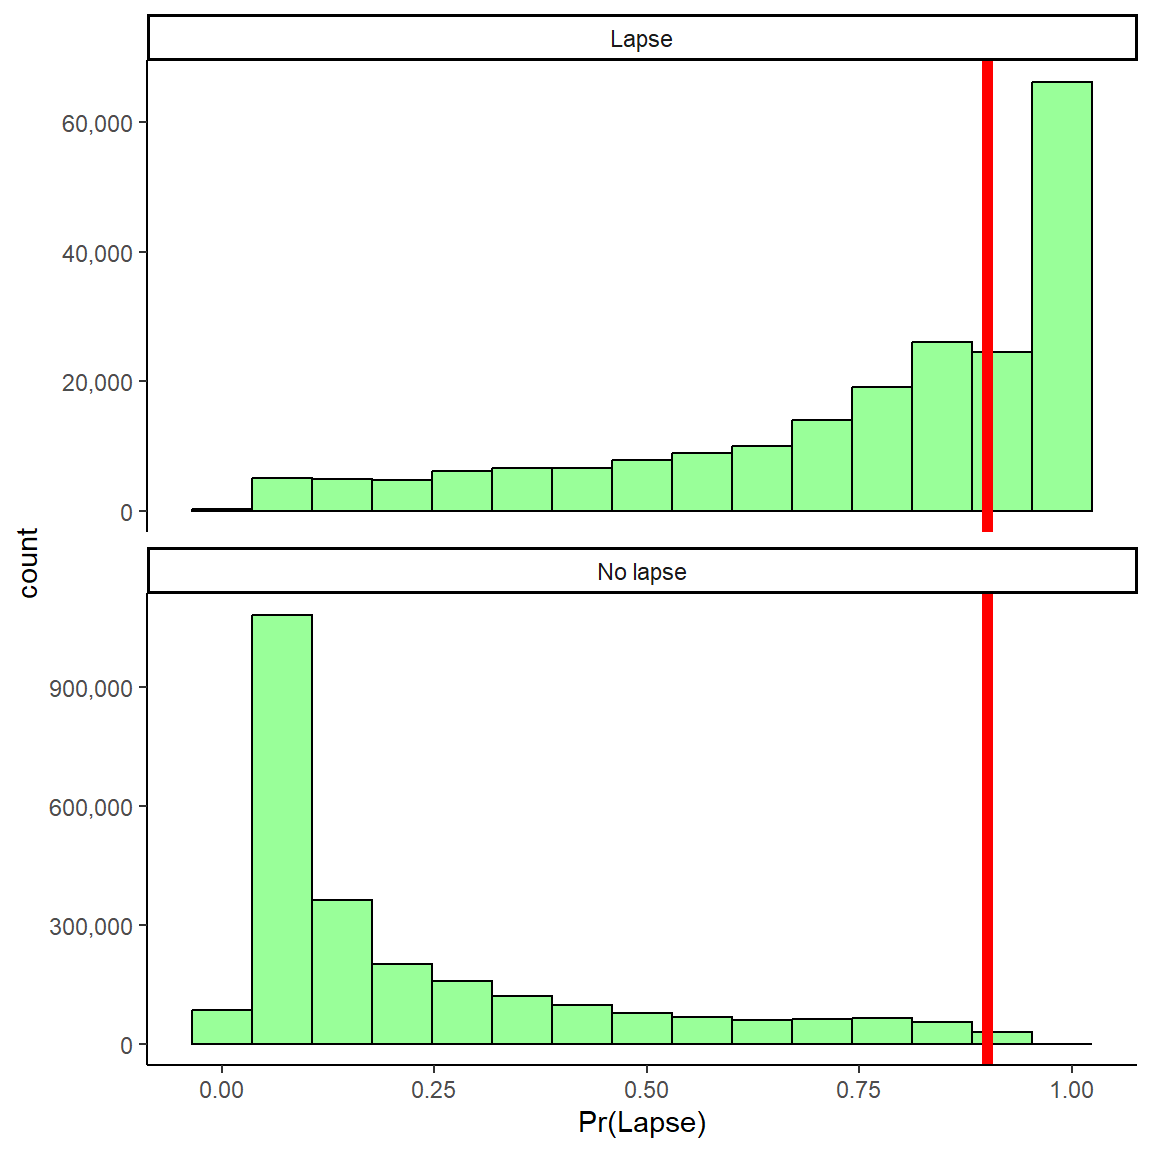
| Thres = 0.50 | Thres = 0.90 | |
|---|---|---|
| Sensitivity | 0.81 | 0.40 |
| Specificity | 0.86 | 0.99 |
| PPV | 0.32 | 0.83 |
Precision - Recall Curves
| Week | Day | Hour | |
|---|---|---|---|
| Threshold | 0.70 | 0.88 | 0.97 |
| Specificity | 0.67 | 0.43 | 0.20 |
| PPV | 0.75 | 0.75 | 0.75 |
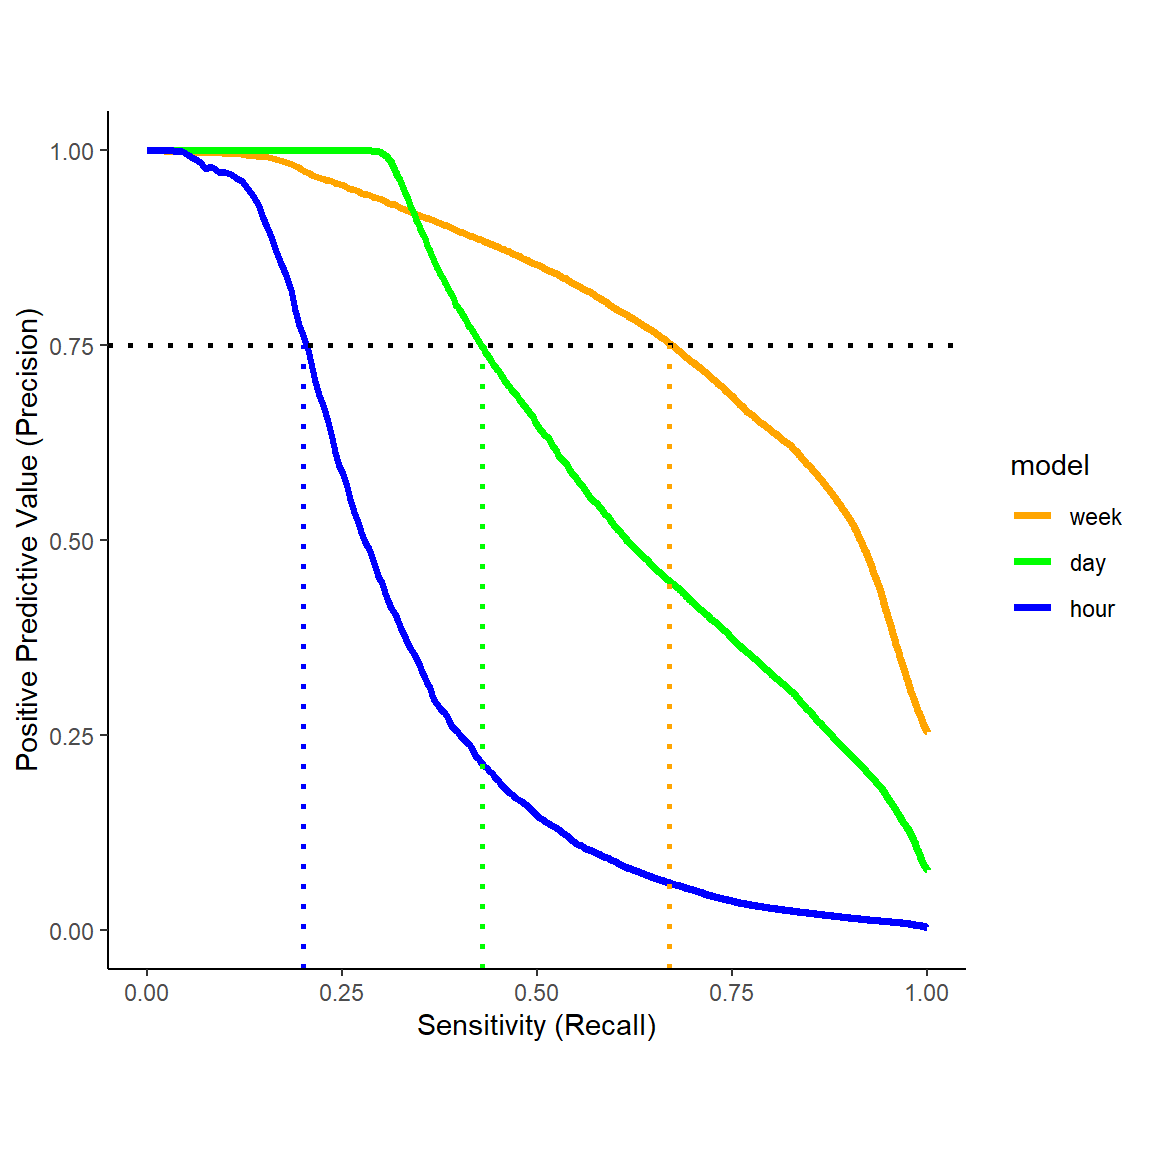
::::
::: {.notes} But of course, as we increase the decision threshold for labeling a window as a lapse, we will trade off sensitivity. We can see this trade off directly in the precision-recall curves on the right. If we decide we need PPV of at least .75, you can see that we still have reasonable sensitivity for the one week window but we start to miss many lapses in the 1day window and more still in the 1hour window.
I’ll return to this a bit more later when we discuss emerging plans for how best to implement these models within a digital therapeutic.
…Imagine my smartphone communications…

Context is Critical

Contextualized Geolocation

Contextualized Communications

Baseline Feature Engineering for GPS
Focus on recent past experiences (6, 12, 24, 48, 72, 168 hours)
Raw scores and change scores (from baseline)
Time spent at important places (e.g, alcohol present, drank at location in past, risky, unpleasant)

Active Project: Lapse in patients with Opioid Use Disorder
- Recruiting 400 - 500 patients in recovery from Opioid Use Disorder (~ 300 so far)
- National sample (size; diversity: demographics, location)
- More variation in stage of recover (1 – 6 months at start)
- 12 months of monitoring
- Closer to real implementation methods

![]()
Relapse Prevention Model

Optimization/Evaluation of an Algorithm Guided Smart DTx
- Lapse probabilities updated daily based on EMA and Geolocation features
- Use lapse probability and locally important features to select optimal DTx modules – guided by Rela
- Provide recommendations designed to encourage engagement
- Algorithm transparency (risk level, change, features)
- Communication factors (empathy, feasibility)
- MRT to optimize recommendation message components
- RCT to evaluate Standard vs. Smart DTx on clinical outcomes
![]()
CRediTs

Consort Diagram
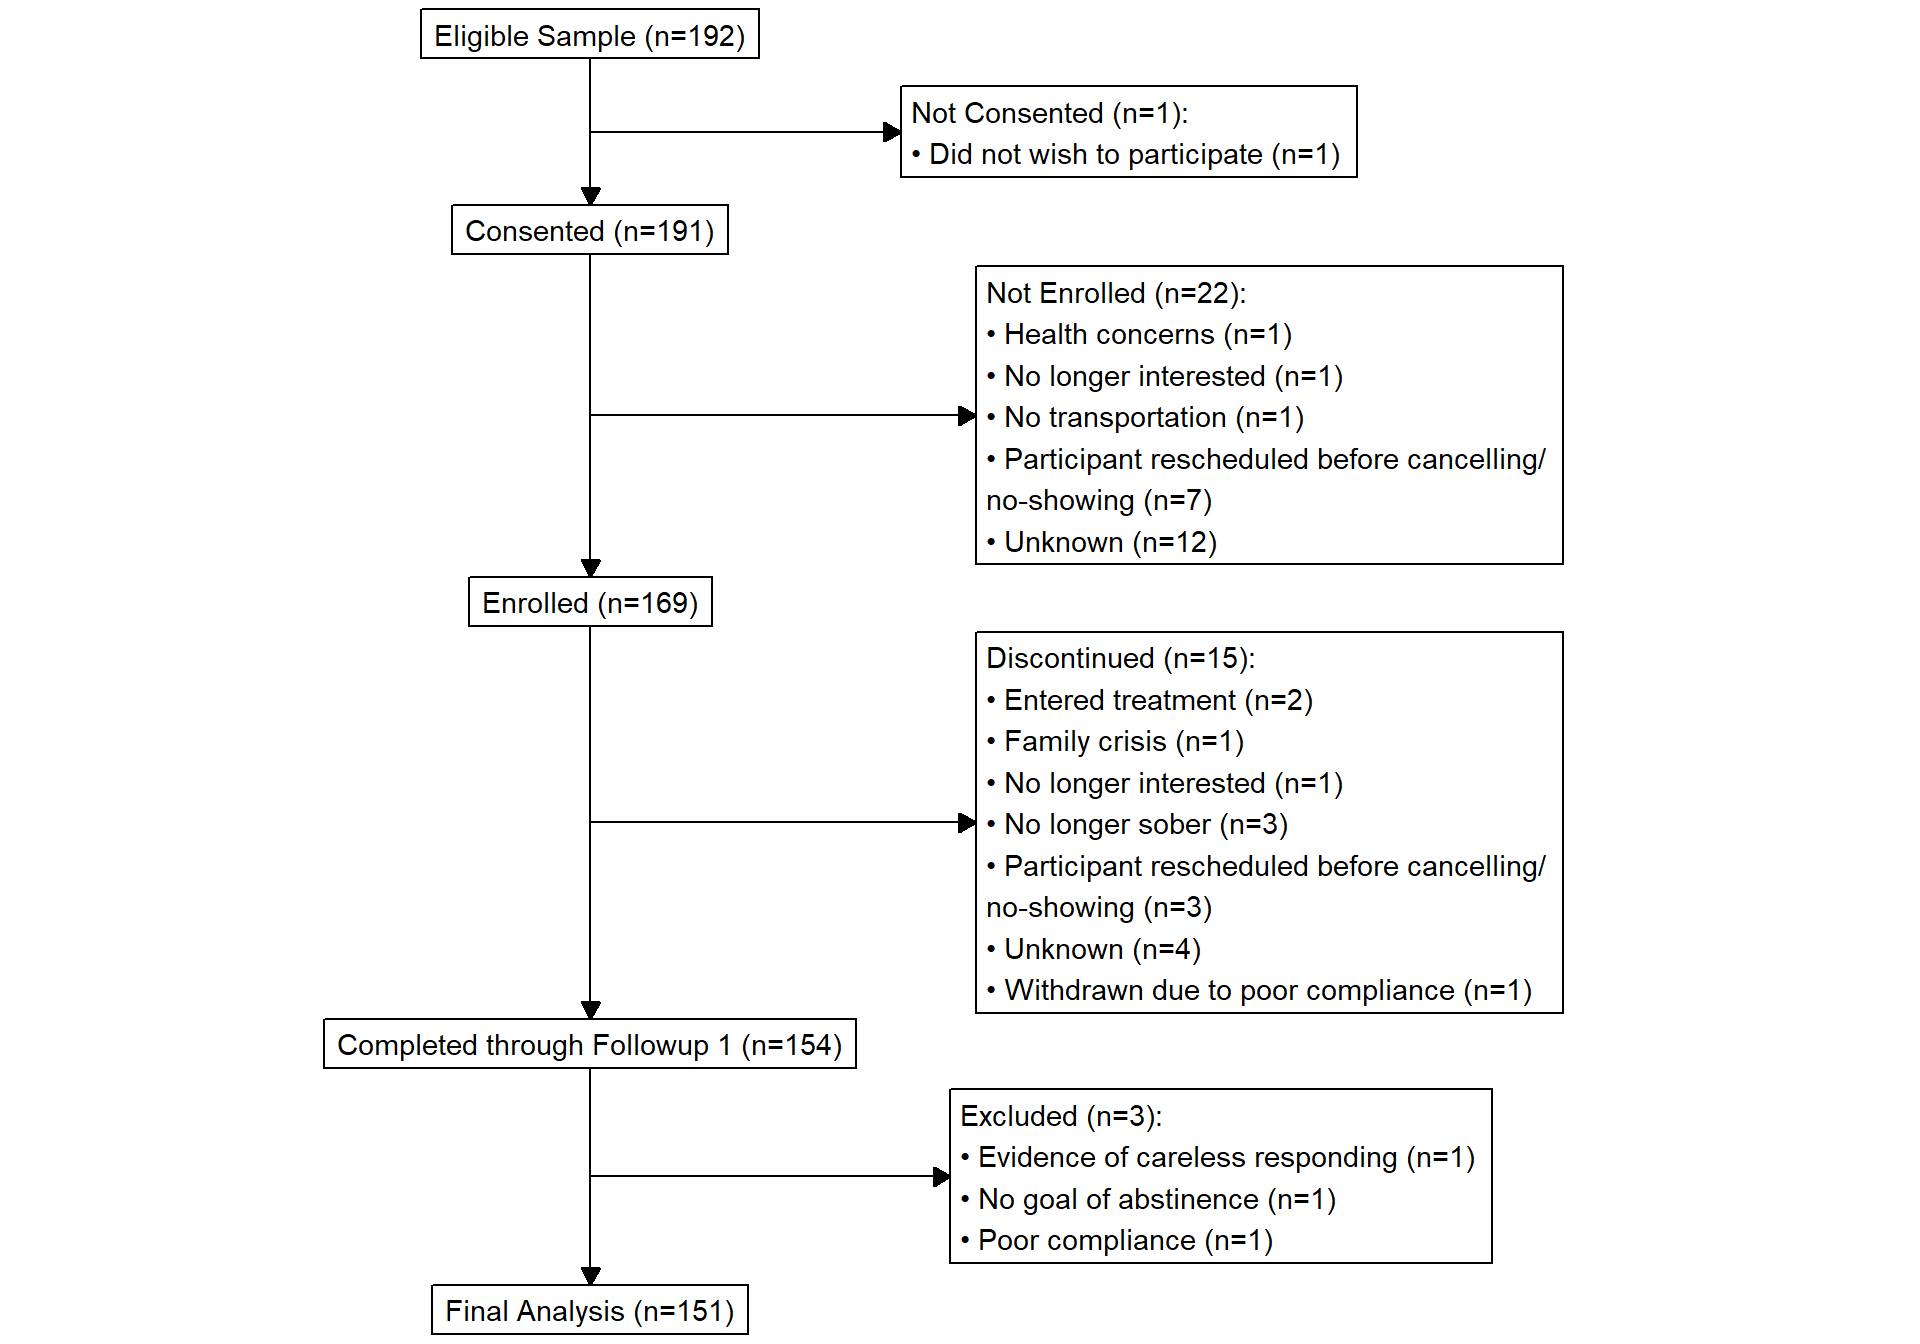
Consort Diagram
ROC Posterior Probabilities
Model Comparison Posterior Probabilites
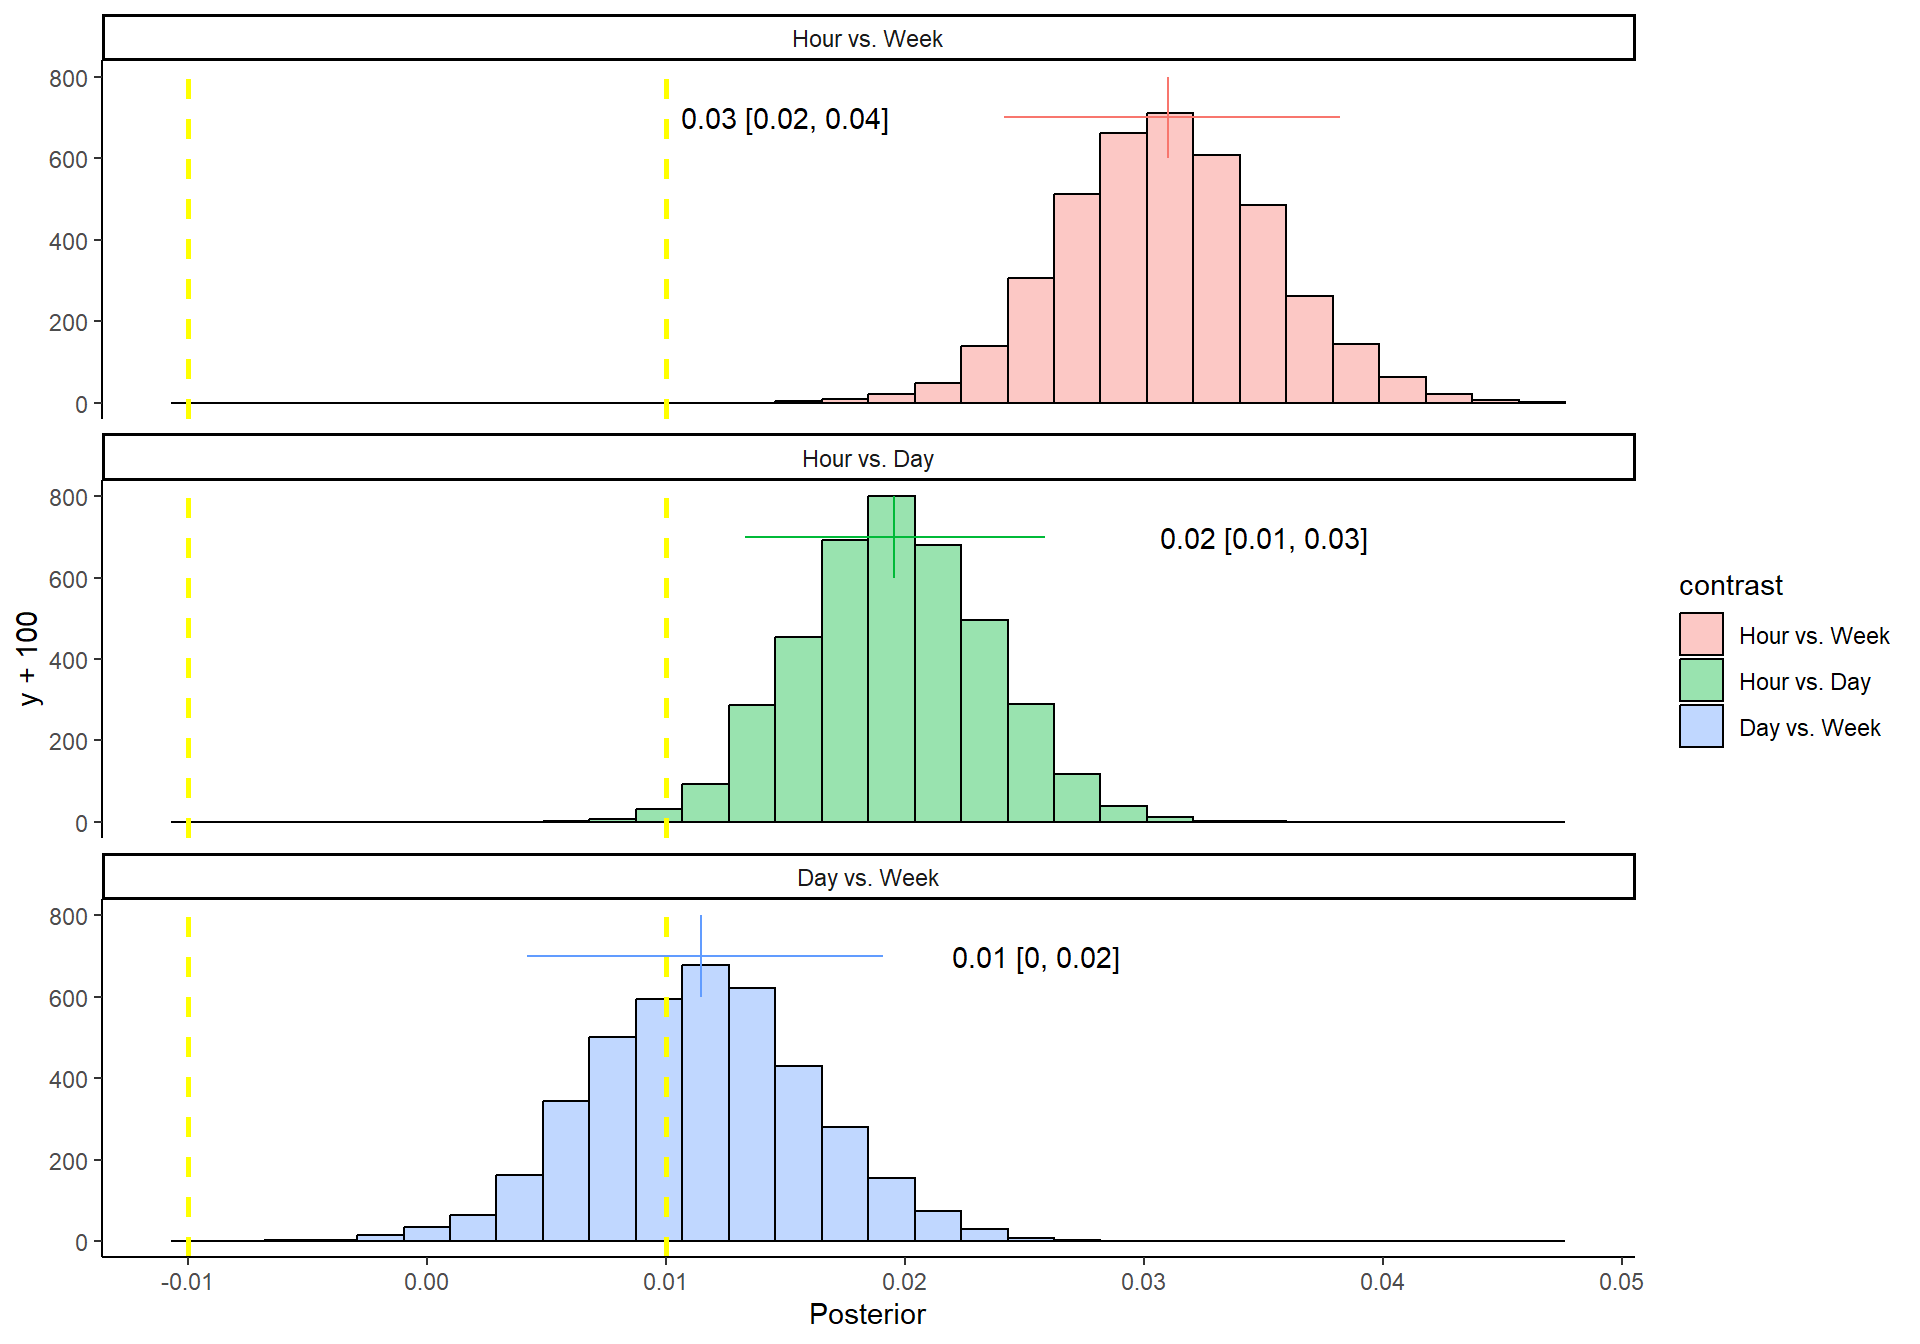
Posterior Probabilities for Model Contrasts for AUC. Region of Practical Equivalence (ROPE) indicated by dashed yellow lines